Traditional metrics like ‘clicks’ and ‘opens’ reflect only part of the actual effectiveness of email marketing campaigns. To remain competitive in this dynamic landscape, businesses should explore the metrics in email reports more deeply.
This article aims to assist businesses in unlocking the full potential of email reports, offering a better understanding of their strengths and areas for improvement. By doing so, companies can make the necessary adjustments to enhance the effectiveness of their email campaigns.
What is email reporting?
Email reporting simplifies email performance data into easy-to-understand visual formats, offering businesses a streamlined way to evaluate the success of their email campaigns and automation.
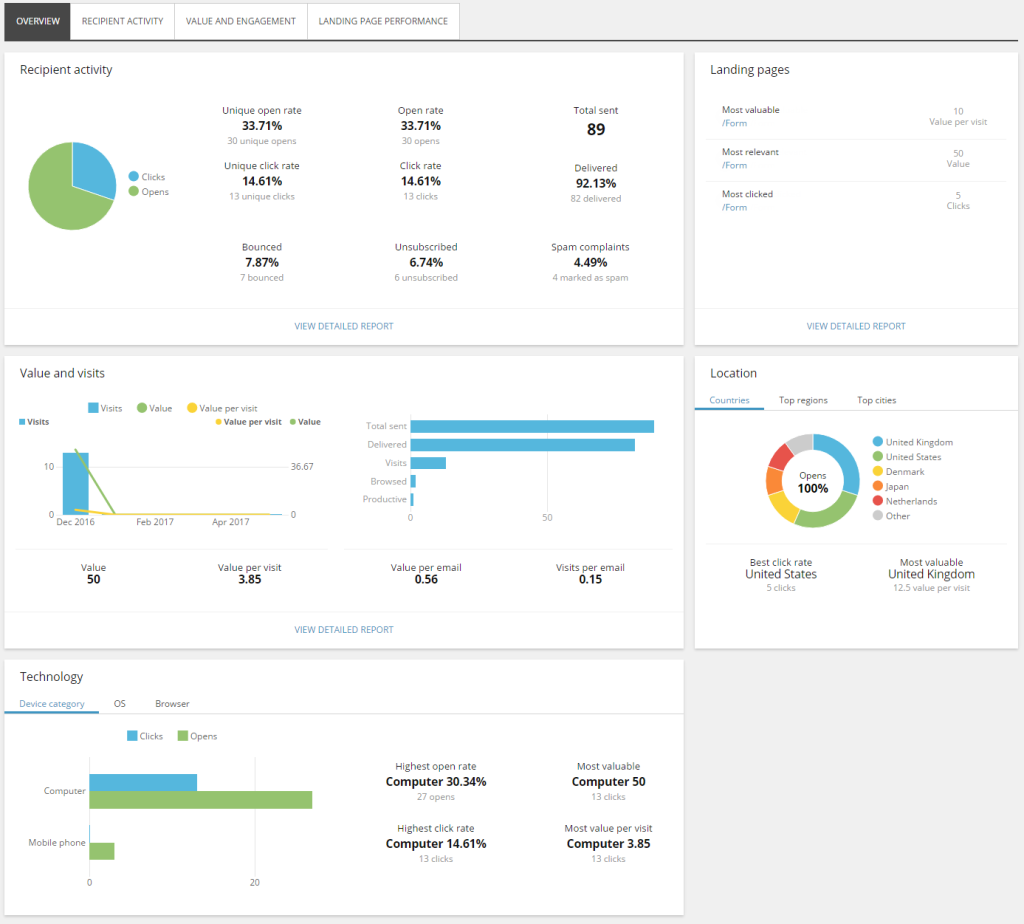
Such visual formats can include charts, graphs, heatmaps, and tables, making it convenient for businesses to grasp the performance data at a glance.
Why is email reporting important?
Email reporting improves resource allocation
By analyzing historical data, you can gain insights into the types of email campaigns that consistently deliver strong results and those that may need adjustments.
Additionally, email reporting also highlights which channels are driving the most engagement and conversions, enabling you to focus your resources on the areas where you’re most likely to achieve success.
Email reporting boosts the performance and automation of the campaign
Advanced email reporting tools can provide insights into industry benchmarks, allowing marketing teams to comprehend the typical ranges for metrics like open rates, click-through rates, and conversion rates.
Regularly comparing metrics over time, such as campaign performance month over month or year over year, enables organizations to track their progress and evaluate the effectiveness of their email strategies.
Email reporting provides valuable insights into audience behavior
By analyzing the engagement patterns of various subscriber groups, you can understand how each segment responds to your email content and messaging.
You can leverage this data to create highly personalized email campaigns more likely to resonate with recipients. If customers who have recently purchased tend to click on product recommendations in your emails, you can design campaigns to deliver personalized product suggestions to this segment.
5 essential email reports for your business
1. Email campaign reports
An email marketing campaign is often delivered as a single email or a series of emails targeting a specific segment of your email list. The primary objective of such a campaign typically revolves around increasing engagement and driving conversions for a specific product or service offer.
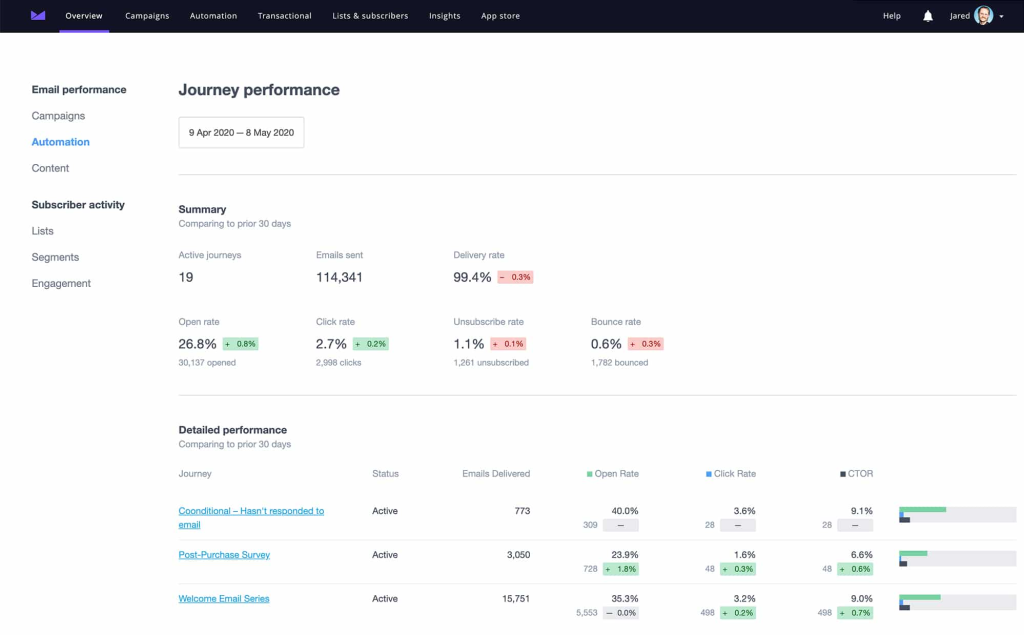
Detailed email campaign reports provide a range of essential metrics and insights. These include:
- Click-through rate: This metric shows the percentage of recipients who opened your email and clicked a link inside. It measures how well your email encourages recipients to take the next step.
- Click rate: The click rate is the percentage of recipients who clicked on a link in your email. It directly measures the effectiveness of your email’s content and calls to action in engaging the audience.
- Active on-site: This metric reveals recipient behavior after clicking your email. It helps in understanding the customer journey and enhancing the user experience.
- Conversion rate: The conversion rate indicates the percentage of recipients who took a desired action after clicking an email, such as making a purchase, subscribing, or filling out a form.
- Revenue per recipient: RPR evaluates the revenue generated from your email campaign relative to the total number of email deliveries. It provides insights into the financial impact of your email marketing efforts.
- Deliverability rates: These rates measure the percentage of emails that reach your recipients’ inboxes. They are crucial for evaluating your email infrastructure and list management effectiveness.
- Unsubscribe rate: The unsubscribe rate is the percentage of individuals who, after receiving your email, decide to opt out of your email list. It reflects the level of disengagement or dissatisfaction among your recipients.
2. Audience segment reports
Audience segmentation reports, often referred to as list reports, provide valuable insights into the performance of specific segments within your overall email list. A typical audience engagement report offers a detailed view of how each segment interacts with your emails, shedding light on their buying potential.
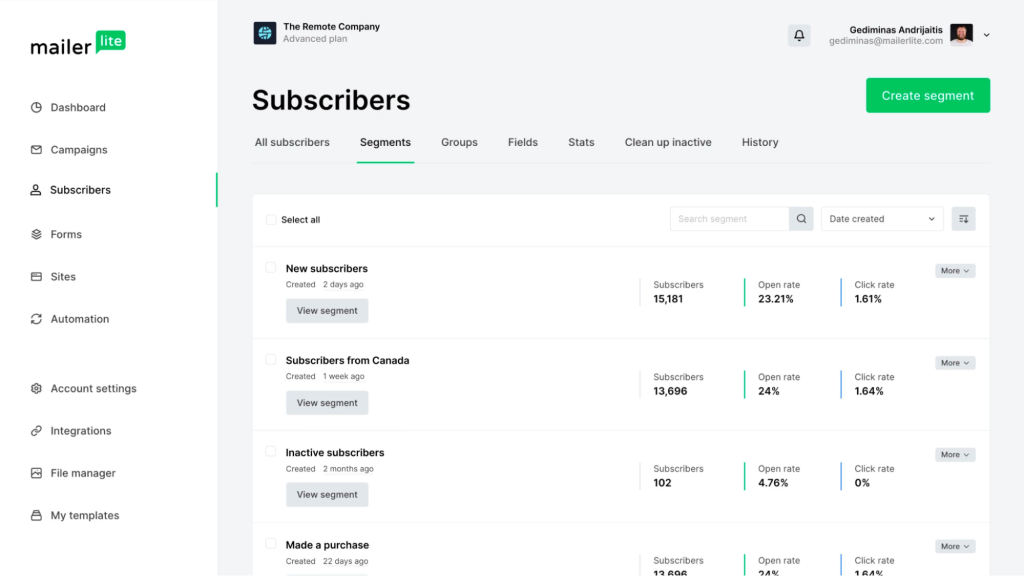
For instance:
- Highly engaged segments: When you notice a highly engaged segment, it’s a great time to send targeted offers as they’re more likely to convert.
- Low engagement segments: If a segment has low engagement, it might be time to clean your email list to maintain deliverability and sender reputation.
3. Email automation reports
Email marketing automation is a dynamic system that sends messages to a broad audience, often triggered by common online behaviors, such as signing up for a newsletter or navigating a website.
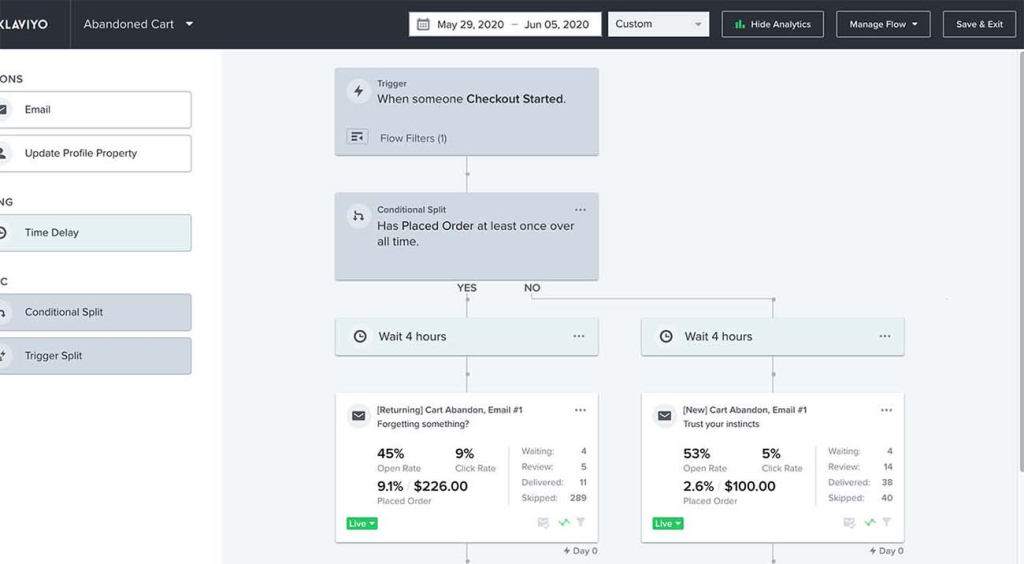
For instance, let’s examine an abandoned cart email campaign and the insights from the report. It reveals that past customers receive emails with a 9% click rate and spend an average of $226 per order, whereas those who haven’t purchased yet have a 5% click rate and an average order value of $100.
4. Cross-channel benchmark reports
Email reporting platforms can gather and analyze results within your specific product category and among brands that are similar to yours.
They let you know how your performance measures up in various key areas:
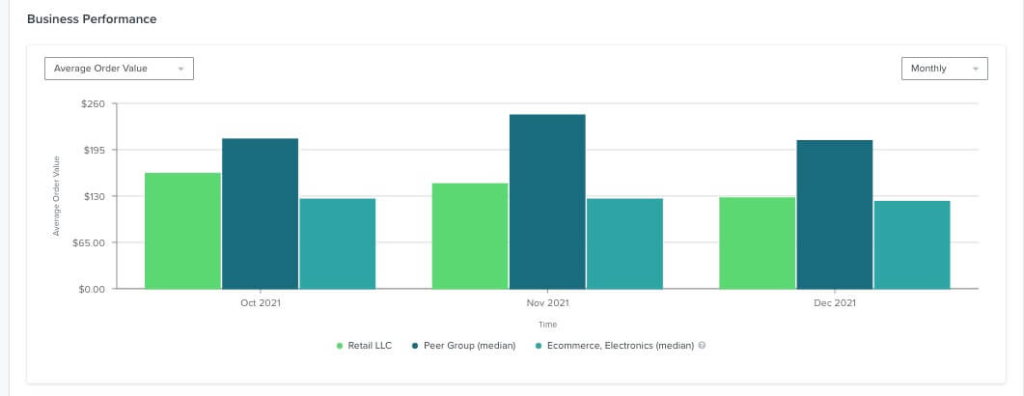
- Business performance: This report section delves into how your brand is doing overall. It evaluates your business’s health and success compared to similar companies.
- Email campaigns: The report assesses how well your email campaigns perform compared to your peers and industry standards.
- SMS campaigns: This report measures the effectiveness of your SMS marketing efforts and compares them to industry benchmarks.
5. Deliverability reports
These reports are instrumental in tracking key deliverability metrics, which encompass a range of critical performance indicators.
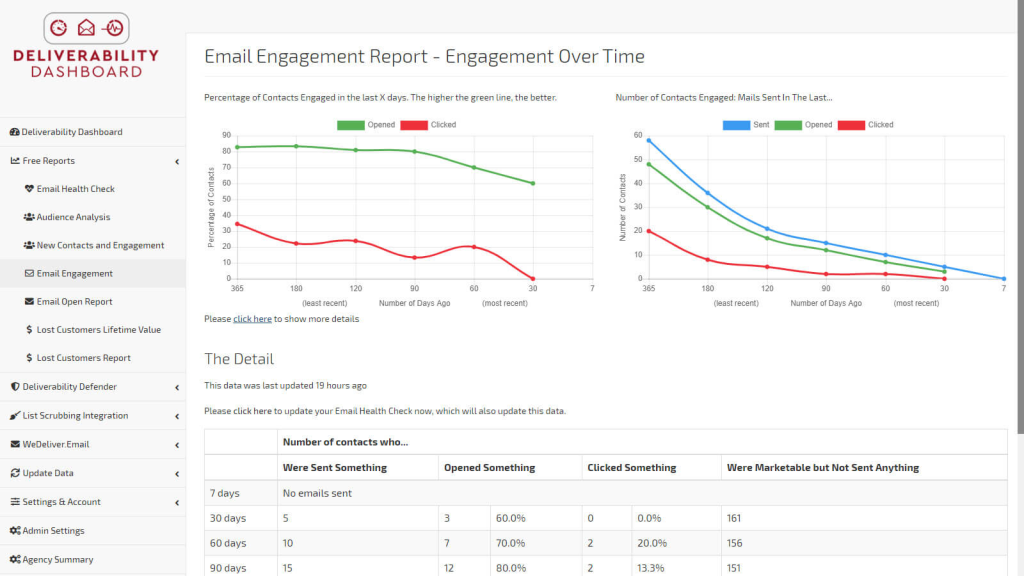
These metrics include:
- Open rate: This metric reflects the percentage of recipients who open your emails, signifying initial engagement with your content.
- Click rate: It measures the percentage of recipients who not only opened your emails but also interacted further by clicking on the links within, demonstrating a deeper level of engagement.
- Bounce rate: This metric identifies the percentage of undeliverable emails for various reasons, such as invalid email addresses or technical issues.
- Unsubscribe rate: It indicates the percentage of recipients who opted out of your email list after receiving your emails, offering insights into audience disengagement.
- Spam complaint rate: It reflects the percentage of recipients who marked your emails as spam, a metric that can significantly impact your sender’s reputation and deliverability.
A deliverability report provides a comprehensive overview of how these critical metrics have evolved over a specified time frame, offering insights into your email marketing performance.
How to customize email reports to level up your business
When creating custom reports, you’ll typically focus on:
- Specific metrics or key performance indicators.
- Multiple interrelated metrics.
- Particular products or product sets.
Custom reports are multifaceted, mirroring the interconnected nature of data. You gain a holistic view of your business by applying filters, adjusting time frames, and adding modifiers.
To create a custom report, follow these steps:
- Select metrics: Choose influencing metrics from a dropdown menu.
- Determine your perspective: Opt for how you want your questions answered, like sums vs. averages or total actions vs. unique actions per recipient profile.
- Specify your group: Use modifiers to categorize data, such as profile property data, for tailored insights.
- Add relevant modifiers: Apply filters to limit results, such as reporting performance for a specific gender.
- Customize your time range: Focus on data within a specific timeframe to see what matters most.
Key Considerations in Email Reporting
Understand attribution windows
Attribution windows play a critical role in email reporting, as they determine how you attribute conversions or actions to specific email campaigns. It’s essential to grasp the following aspects:
- Attribution models: Different attribution models credit conversions to various touch points along the customer journey. Common models include first-click, last-click, linear, and time-decay attribution.
- Timeframes: Consider whether your business benefits more from short-term or long-term attribution windows, depending on your sales cycle and the nature of your products or services.
- Multi-channel attribution: Email marketing is often part of a broader marketing ecosystem, including channels like social media, search, and display advertising.
- Conversion paths: Evaluate the customer journey by analyzing multi-touchpoint paths to conversion. Understand how email interacts with other channels in guiding customers toward a purchase.
Key metrics in email reporting
The choice of metrics for your email reporting should align with your specific goals and objectives. However, the following metrics are pivotal in email reporting:
- Open rate
- Click-through rate (CTR)
- Conversion rate
- Revenue per email (RPE)
- Bounce rate
- Unsubscribe rate
- Engagement over time
- Multi-channel attribution
- Segmentation metrics
To create an effective email reporting strategy, it is essential to adopt a holistic approach that considers the customer journey, multi-channel touchpoints, and the interplay between these metrics.
Conclusion
In a rapidly evolving digital landscape, embracing this broader approach to email reporting is not merely a choice — it’s a necessity. By knowing what you’re measuring, building easy-to-read reports, and using the right tools, your email program will be on the path to success.


